

LTPI

Frame Report
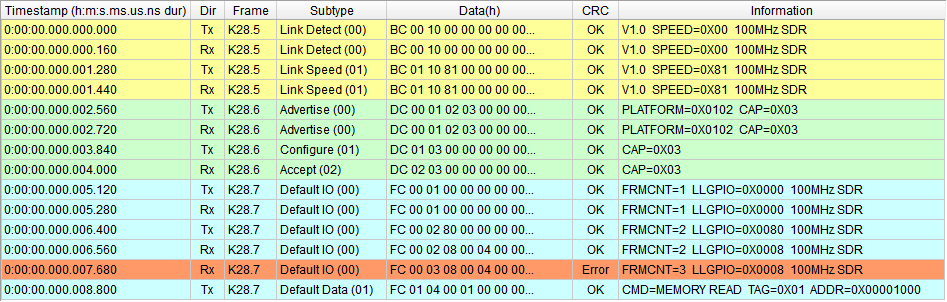
Lists Tx / Rx frames in time order with frame type, subtype, CRC check result and full field decode; clicking a row shows the 16 raw bytes and a field-by-field breakdown in the detail pane.
Tunneled Report
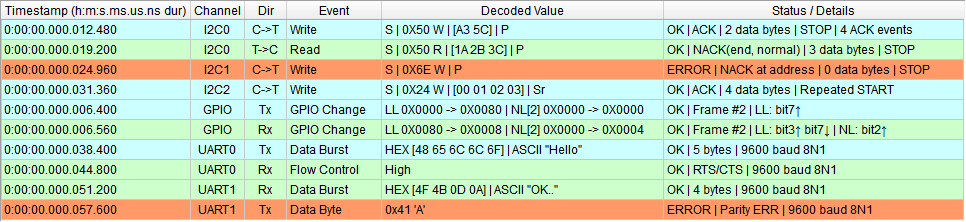
Reconstructs the tunneled channels: complete I2C transactions on channels 0–5 (Start / address / R/W / ACK / data / Stop), GPIO bit changes (both low-latency LL and normal-latency NL classes), and UART byte reconstruction on channels 0–1 including RTS / CTS flow-control events; offers Combined (merged with the Frame Report) and Separate views.
Statistics
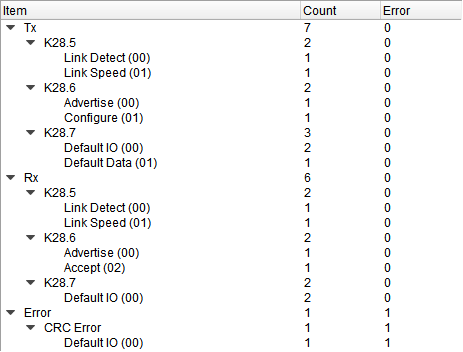
Accumulates frame counts by Tx / Rx / Error with per-type and per-subtype breakdown; errors are further classified as CRC, Symbol, Disparity and Incomplete; clicking an entry jumps to the corresponding frame.
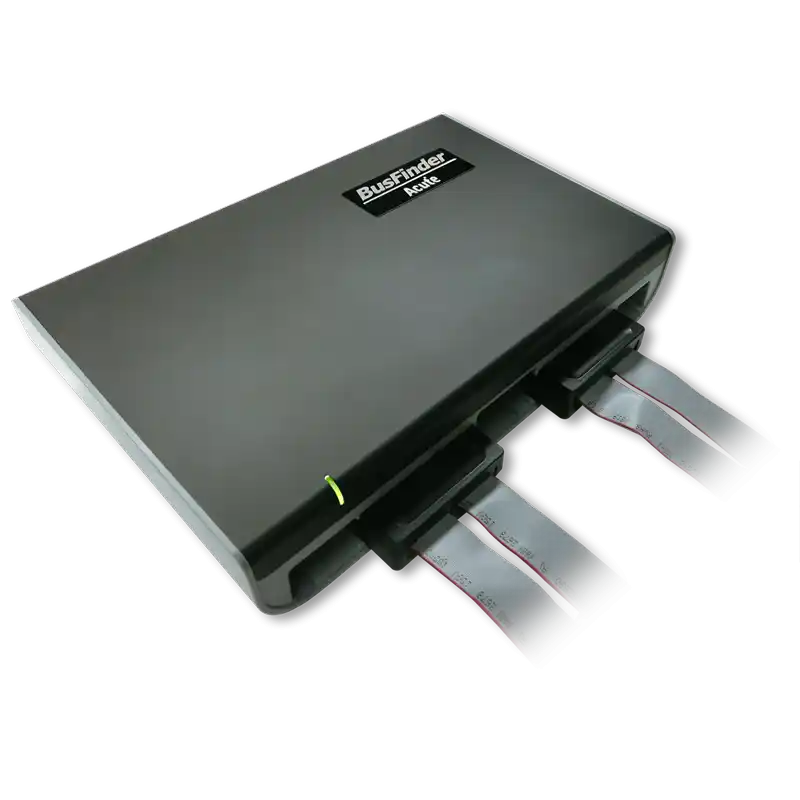
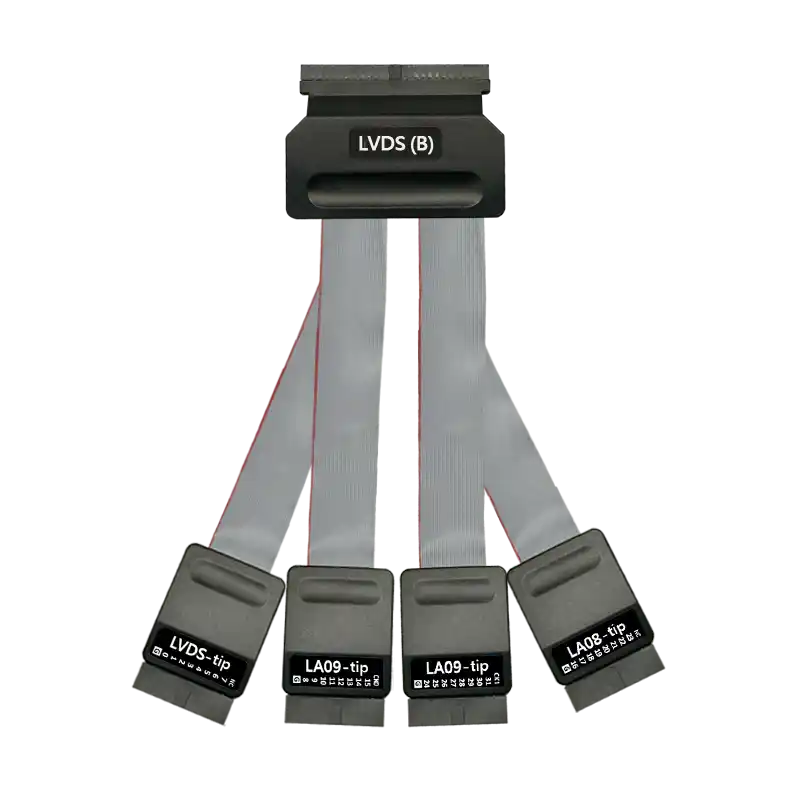
LVDS POD (LA Mode)
8b10b
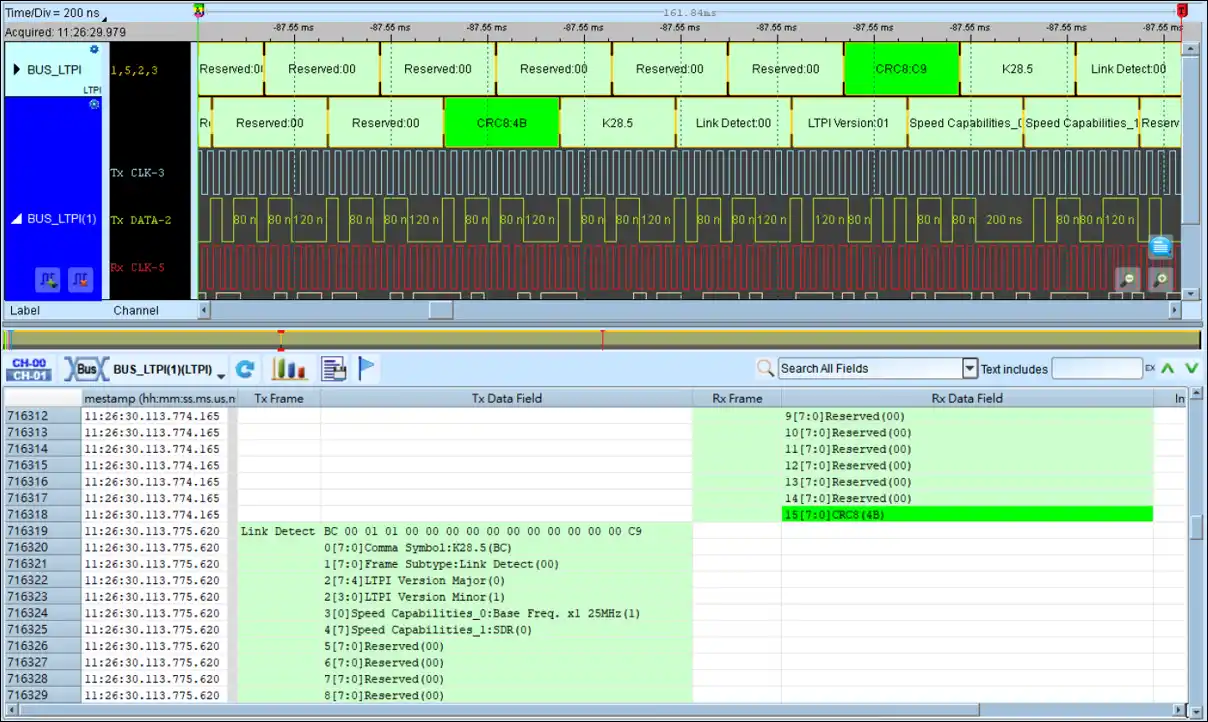
LTPI Packet, including command decoding
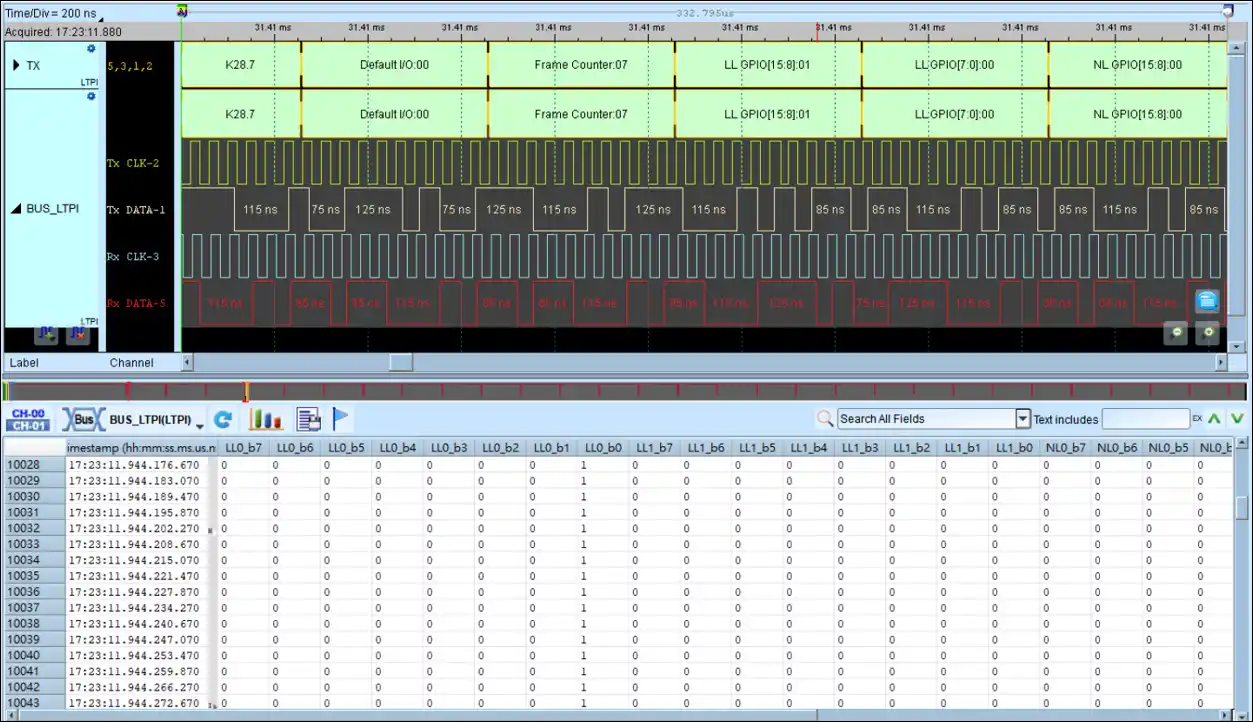
GPIO / I2C / UART Packet
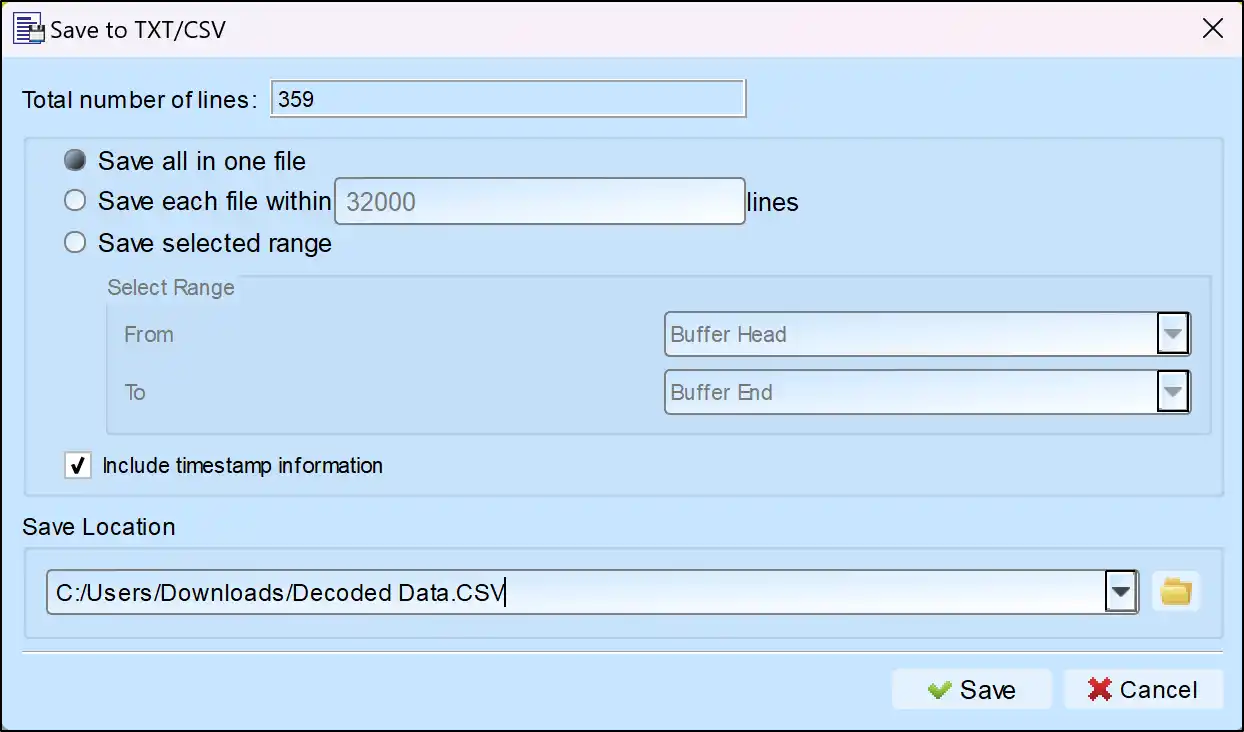
Save as TXT/CSV
In Logic Analyzer mode, click the icon above the report area to save the decoded data as a TXT/CSV file.

LTPI Decoding Setup Steps
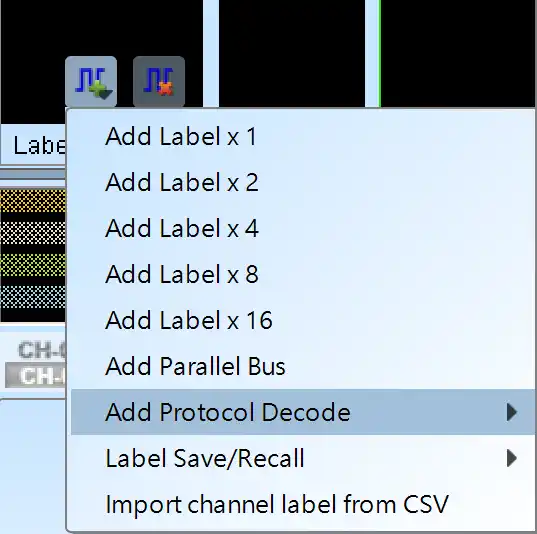
1. Click Quick Settings or Add Protocol Decode to select a protocol for logic analyzer capture.
2. Select LTPI for decoding.
3. If you use Quick Settings, the system will recommend configurations for trigger type, sampling rate, voltage threshold, and channel settings.
4. Click the icon to access the Decode Settings screen.

Decode Settings
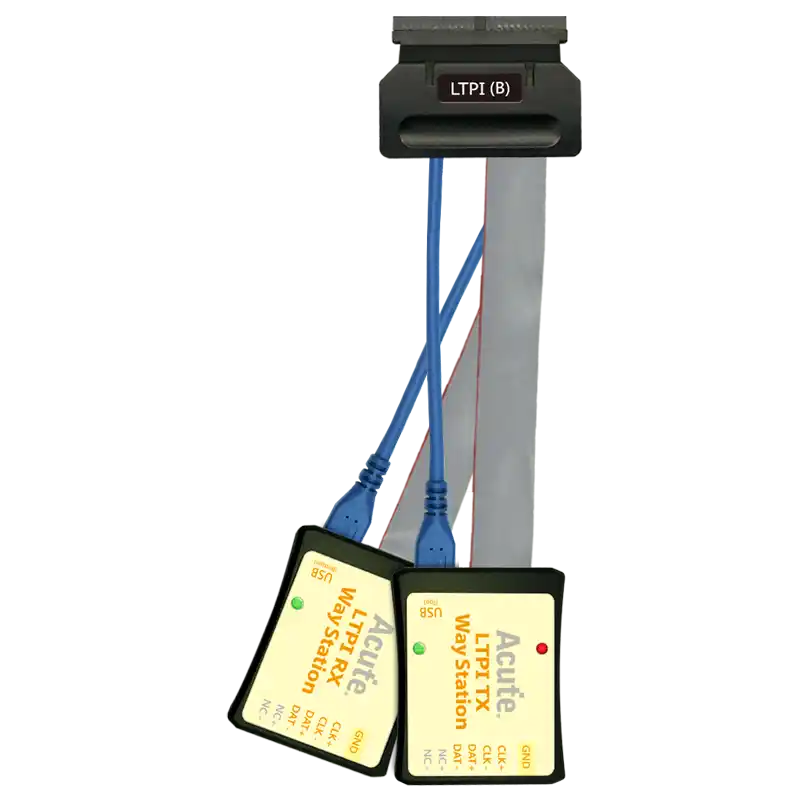
Assign the test signals of the DUT to the corresponding logic analyzer channels:
Tx Clock
Tx Data
Rx Clock
Rx Data
SDR: The DUT transmits signals in Single Data Rate mode.
DDR: The DUT transmits signals in Double Data Rate mode.
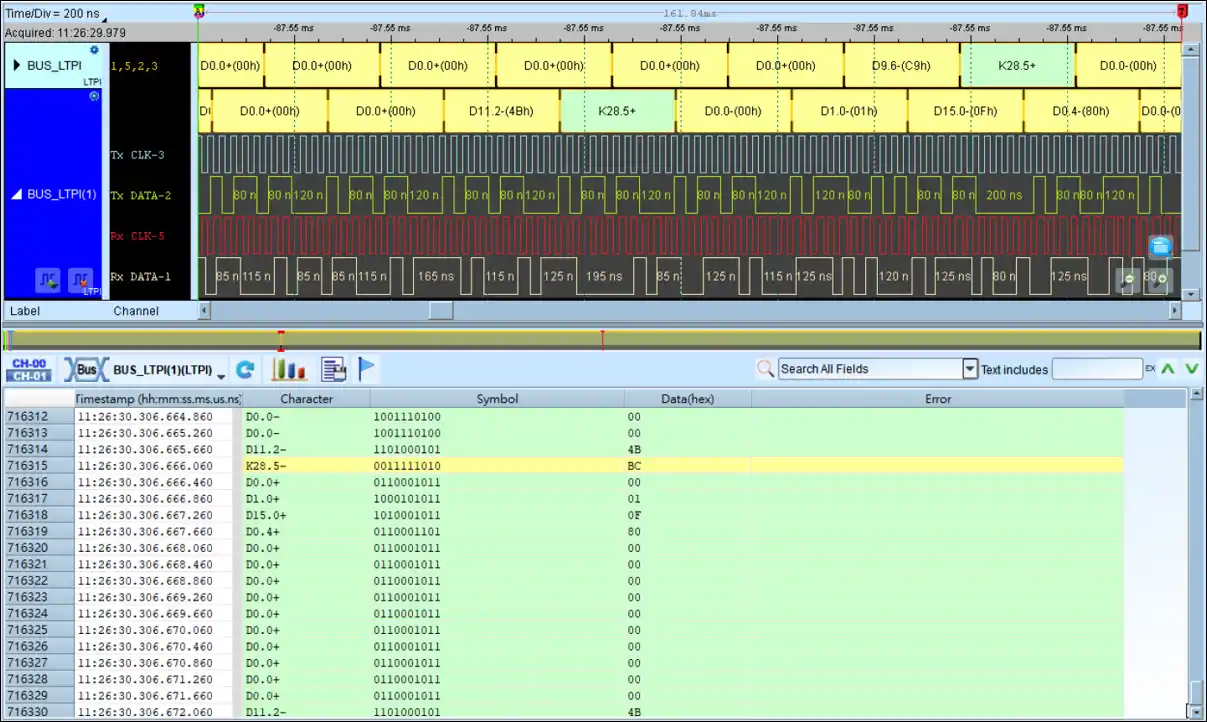
Waveform: Displays the direction (Transmit / Receive) and the decoded content — 8b10b / LTPI / GPIO / UART / I²C.
Detail Report: Enable or disable detailed reporting.
Import GPIO CSV: Enable importing bit names for GPIO signals.


[LL0] indicates the bit name mapping for Low Latency GPIO-0 (bits 7–0).
[LL1] indicates the bit name mapping for Low Latency GPIO-1 (bits 7–0).
[NL0] indicates the bit name mapping for Normal Latency GPIO-0 (bits 7–0).
[NL1] indicates the bit name mapping for Normal Latency GPIO-1 (bits 7–0).